Faith Lutheran College - Redlands
Compare Independent Coeducational School

| School Type | Combined |
|---|---|
| Year Range | U, Prep-12 |
| Address | 132 LINK ROAD Victoria Point QLD 4165 |
| Phone | 07 3820 5500 |
| Website | http://www.faithlutheran.qld.edu.au |
| Gender | Co-Education |
| Region | Metropolitan |
|---|---|
| Students | 1002 |
| Boys | 514 |
| Girls | 488 |
| ICSEA Value | 1067 |
| Aus. Average | 1000 |
| Finances per student | $14,681 |
|---|---|
| Aus. Average per student | $17,550 |
| Australian Government | 45% |
| State/Territory Government | 13% |
| Fees, parent contributions etc | 41% |
| Others | 1% |
| 2015 | 2014 | 2013 | 2012 | 2011 | 2010 | 2009 | |
| NAPLAN (Primary) | N/A | N/A | N/A | ||||
| NAPLAN (Secondary) | N/A | N/A | N/A | ||||
| OPs|QCE | N/A | N/A | N/A |
1001; Full Time Student Teacher Ratio: 14.4/11067;| Bottom Quarter | Middle Quarters | Top Quarter | ||
| Student Distribution | 8% | 25% | 38% | 30% |
| Australian Average | 25% | 25% | 25% | 25% |
1072; Full Time Student Teacher Ratio: 16.4/11064;6%| Bottom Quarter | Middle Quarters | Top Quarter | ||
| Student Distribution | 7% | 27% | 39% | 27% |
| Australian Average | 25% | 25% | 25% | 25% |
1103; Full Time Student Teacher Ratio: 16.1/189%1058;7%| Bottom Quarter | Middle Quarters | Top Quarter | ||
| Student Distribution | 9% | 27% | 39% | 26% |
| Australian Average | 25% | 25% | 25% | 25% |
1104; Full Time Student Teacher Ratio: 16.3/195%1073;3%| Bottom Quarter | Middle Quarters | Top Quarter | ||
| Student Distribution | 5% | 24% | 46% | 25% |
| Australian Average | 25% | 25% | 25% | 25% |
1066; Full Time Student Teacher Ratio: 16.9/195%1076;5%| Bottom Quarter | Middle Quarters | Top Quarter | ||
| Student Distribution | 7% | 22% | 47% | 24% |
| Australian Average | 25% | 25% | 25% | 25% |
1046; Full Time Student Teacher Ratio: 16.3/196%1081;4%| Bottom Quarter | Middle Quarters | Top Quarter | ||
| Student Distribution | 8% | 20% | 39% | 34% |
| Australian Average | 25% | 25% | 25% | 25% |
1007; Full Time Student Teacher Ratio: 15.8/190%1022;8%| Bottom Quarter | Middle Quarters | Top Quarter | ||
| Student Distribution | 9% | 42% | 37% | 12% |
| Australian Average | 25% | 25% | 25% | 25% |
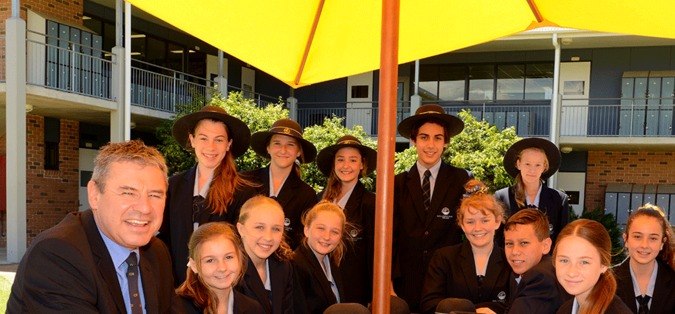
Faith students... preparing for life
Faith Lutheran College, Redlands, has built a strong reputation in the Redlands for its caring, Christian and community-minded approach to education.
The college’s key goal is to prepare its students for life, and this is reflected in everything Faith does, with students encouraged to be caring and community-minded members of society.
Students are given many opportunities to make a real difference in the Redlands, as well as through key school projects that allow children to offer state and international aid to communities in need.
The strong academic focus is enhanced by a supportive Christian environment. This approach is one that is consistent in Lutheran schools across Australia, earning them an excellent reputation for enhancing student outcomes. Faith offers a broad range of academic experiences and subjects, including Vocational Education and Training (VET) and flexible learning pathways, plus the latest in computing and technology.
Students are acknowledged and treated as individuals and it is this tailored teaching approach that continues to give each child the educational opportunities they need to reach their full potential.
While encouraging students to excel academically, Faith also has a deep commitment to developing and broadening their leadership skills through a range of programs and educational opportunities.
Faith’s music and arts program gives students every opportunity to develop their passion, and as a result the college has made a name for itself in producing talented musicians, actors and artists. Faith prides itself on offering students a wide range of sports — from rugby union, netball, soccer and tennis, to volleyball, softball, cricket, basketball and AFL. As a member of The Associated Schools (TAS), students also have the chance to compete against other colleges in their chosen sports.
These programs have seen Faith students selected for the Brisbane Lions Academy, the Australian Institute of Sport’s AFL Academy, the Australian Ballet and represent the nation in the World Robotics Championships.
Faith has grown significantly since it opened its doors in 1982, and offers a junior, middle and senior school, housed across two extensive campuses in the Redlands.
Prep to Year 12
Junior School Campus: 132 Link Road, Victoria Point QLD 4165
Middle/Senior School Campus: 1–15 Beveridge Road, Thornlands QLD 4164
Phone: Junior School 3820 5200, Middle/Senior Schools 3820 5500
Email: office@faithlutheran.qld.edu.au
Intake: All years where vacancies exist
Scholarships: Scholarships and bursaries are offered
Visit our website for further information, www.faithlutheran.qld.edu.au.
Schools closest to Faith Lutheran College - Redlands
| School name | Address | Type | Sector | Distance |
|---|---|---|---|---|
| Victoria Point State School | SCHOOL ROADVictoria Point 4165 | Primary | Government | 0.35 km |
| St Rita's Primary School | Victoria Point 4165 | Primary | Catholic | 0.66 km |
| Victoria Point State High School | BENFER ROADVictoria Point 4165 | Secondary | Government | 1.06 km |